
Hostwinds Tutorials
Search results for:
Grafana Overview
Grafana is an open-source program that allows you to visualize the metrics of your database. You can use almost any database to create these dashboards that can help you query, alert, visualize, and fully understand all of the metrics of your database. With that, in this guide, we will be going over some of the features that you will have when you install Grafana.
There are many helpful features that you can use through Grafana's plugins. Here are some of those helpful features.
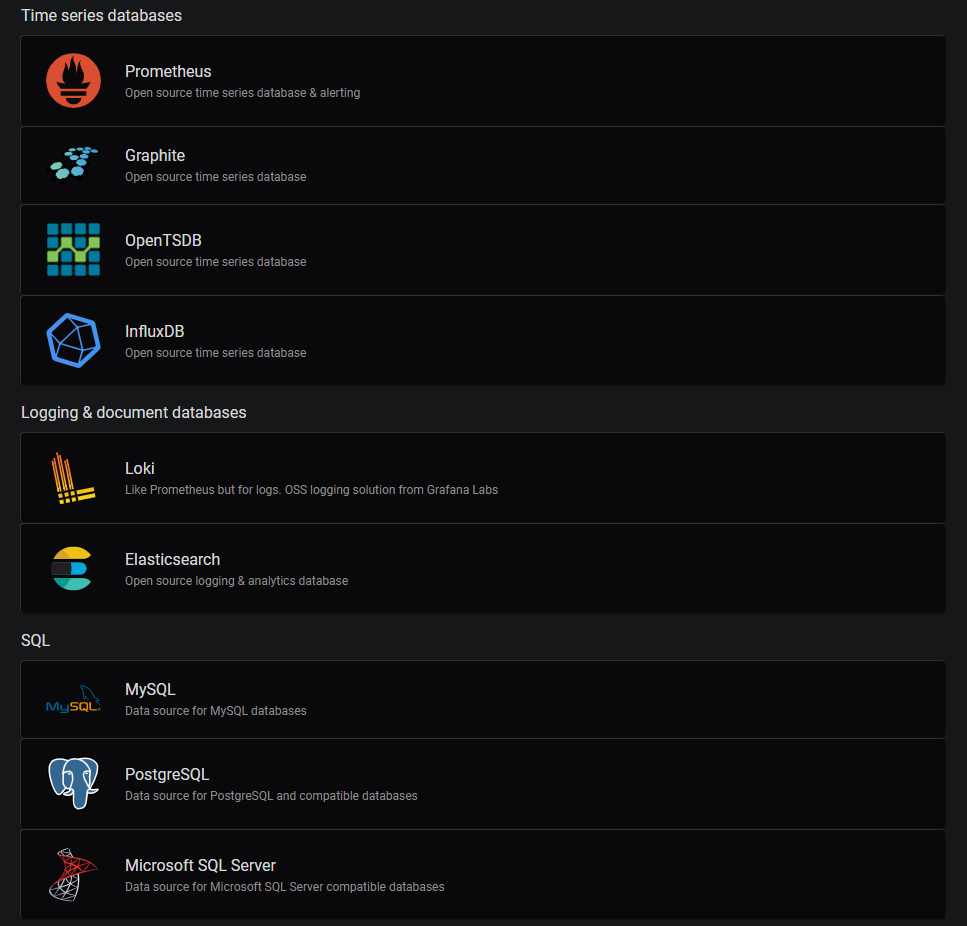
- Data source support: Grafana has support for many different data source options. These options include MySQL, InfluxDB, Microsoft SQL, Graphite, and many more. Lastly, You can also mix multiple data sources into one graph.
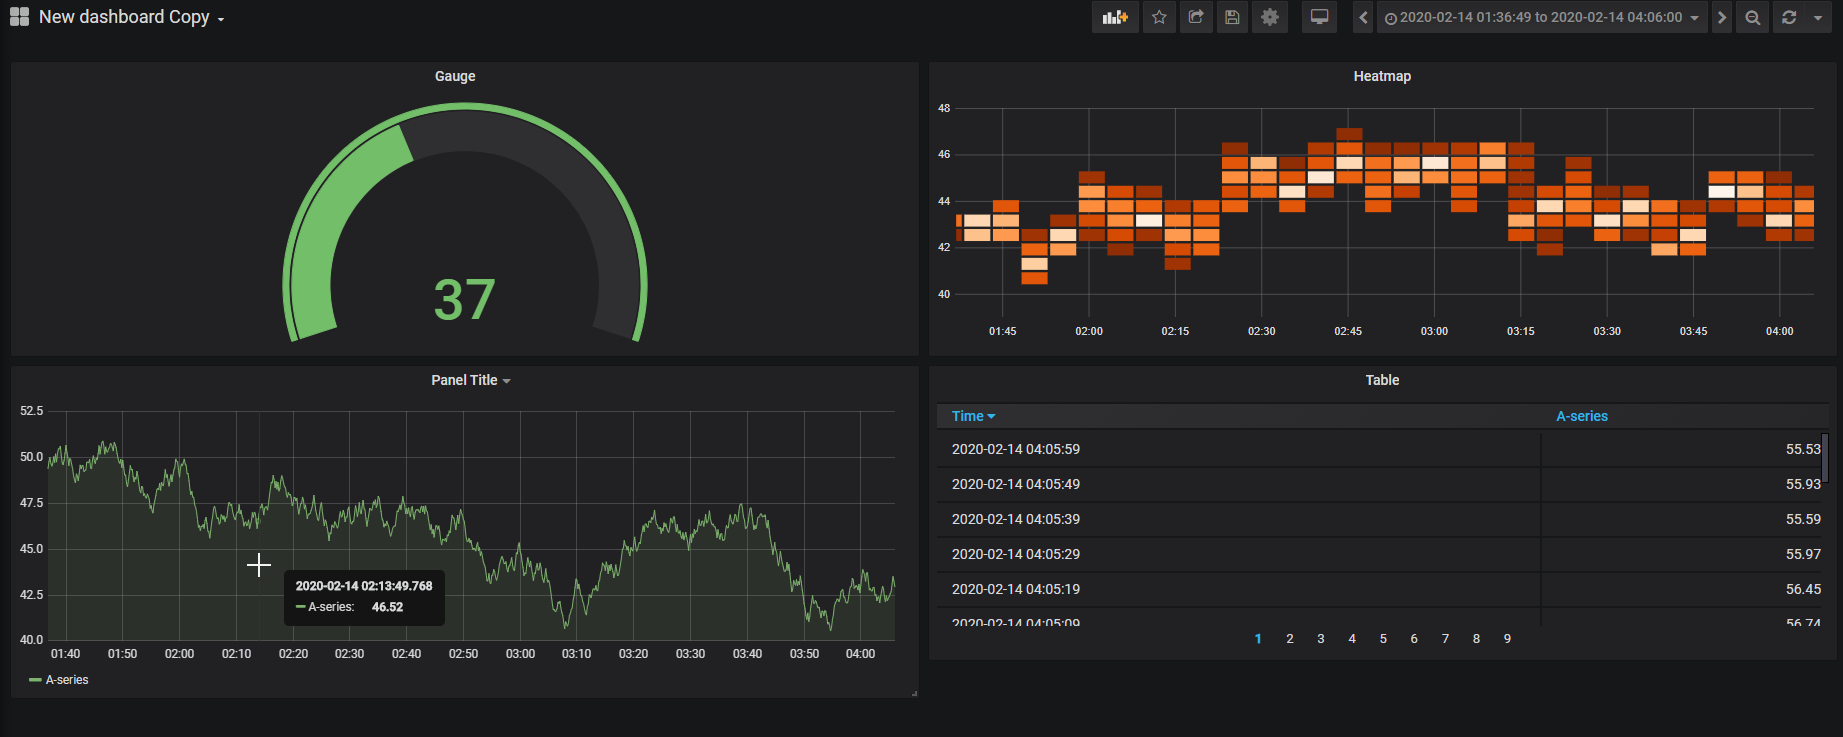
- Dashboards: Visualize your data differently by creating Dashboards that can be used for all of our data. Once you create a dashboard, it can be reused for all of your data sources. You can even combine multiple data sources in a dashboard to compare. There are many different panels and graphs you can use to see all your data in many different ways.
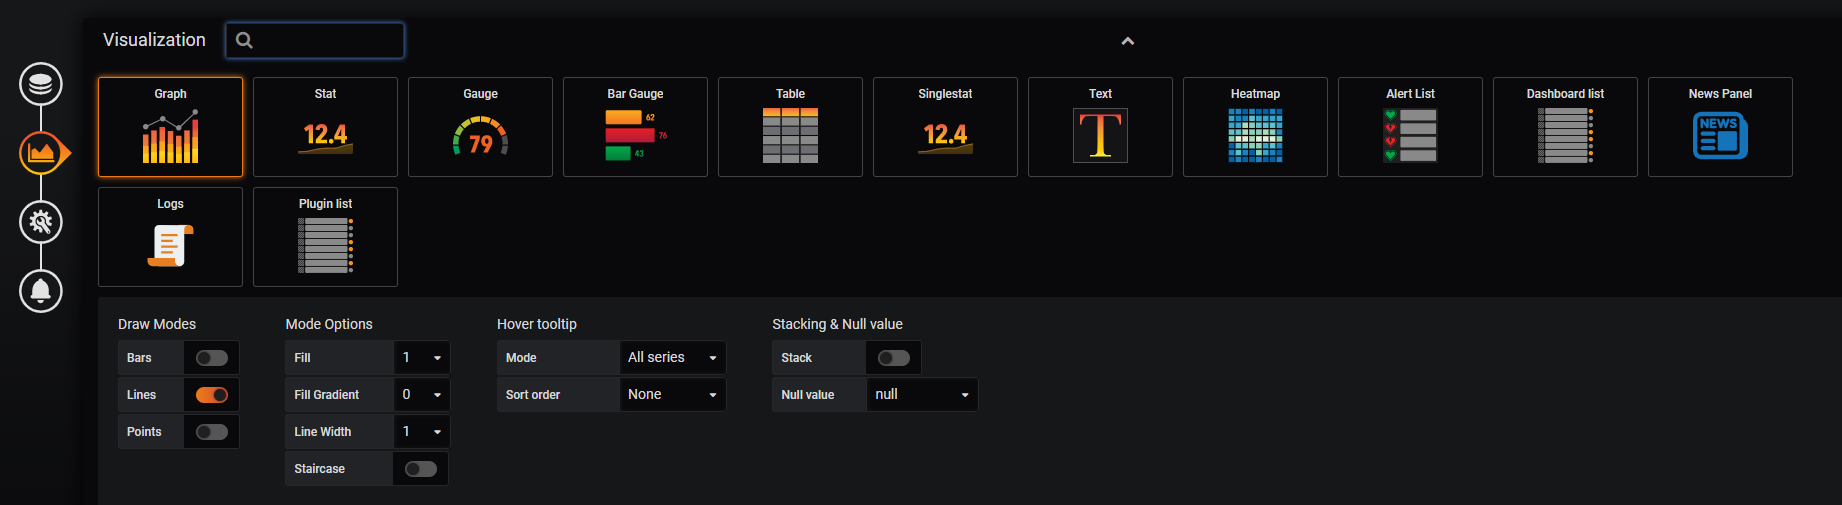
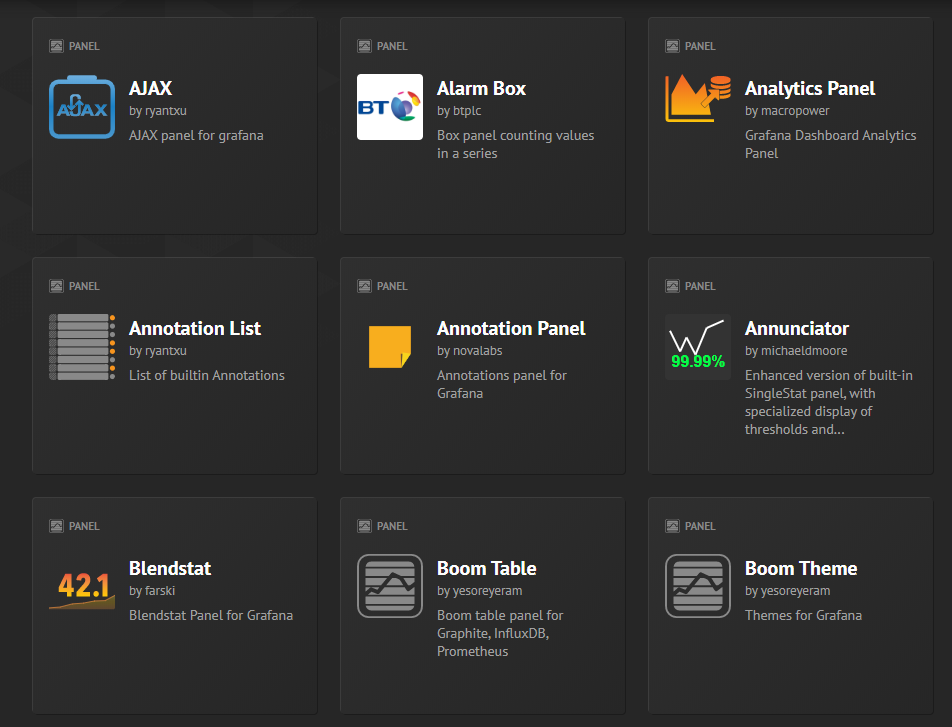
- Panel options: There are many different options that you have to make panels put into dashboards. Some of the panels you can use are alerts, error logs, annotations, and metric evaluation.
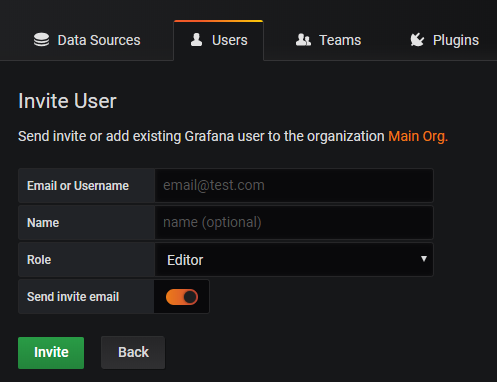
- Users and Teams: Easily Invite users by just sending an email. You can also create teams to differentiate the users that you invite.
- Plugins: The last big feature in Grafana is the plugin list. There are a huge amount of plugins that you can install from Grafana's pool. These plugins were made by team members at Grafana, along with some community-based plugins as well. However, you would like to visualize your metrics. There is a plugin to do it. (Pictured are 3 of the many plugins)
Written by Luke Johnston / March 20, 2020